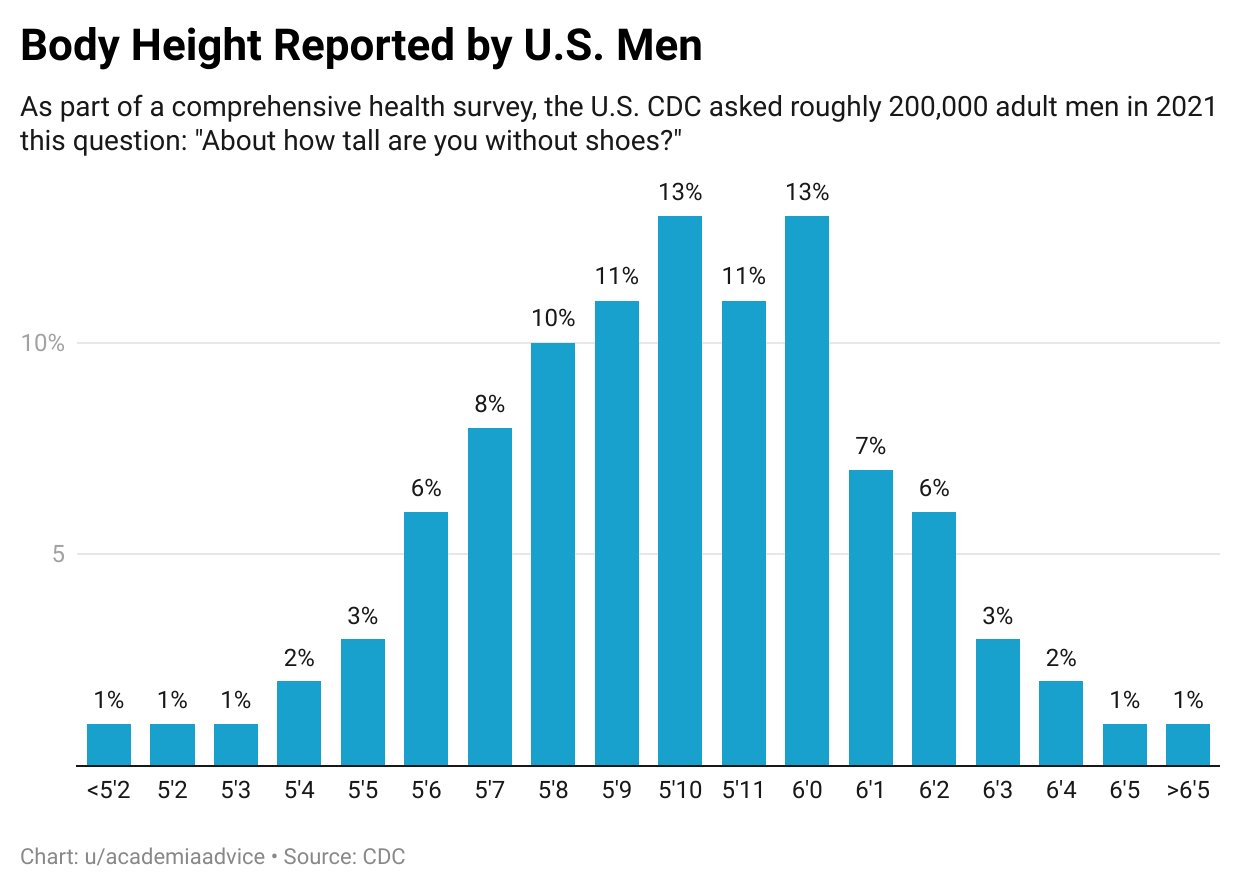
Just using this data to show how stupidly wealth is currently distributed in the country assuming 5’11" or 1.8 meters average if we converted this into 2022 wealth values with average income of 61,136, top 1% as 785,968 (12.9x), and 0.1% 2.8 million (458x) the top 1% height would be 23.22 meters and 0.1% would be 824.4 meters tall.
Naturally occurring normal numeric distributions will tend towards a bell shape, or curve, as you acquire observations. Artificial distributions like income will follow a different curve that is sometimes difficult to visualize especially when the differences are measured in millions or billions. It’s easier to visualize the differences in artificial distributions if you use a natural distribution as a familiar basis.
Tl;Dr Do you think Paul Bunyan and Paul Blart are related?

Just using this data to show how stupidly wealth is currently distributed in the country assuming 5’11" or 1.8 meters average if we converted this into 2022 wealth values with average income of 61,136, top 1% as 785,968 (12.9x), and 0.1% 2.8 million (458x) the top 1% height would be 23.22 meters and 0.1% would be 824.4 meters tall.
I’m pretty high and I can’t make an ounce of sense of what you’re on about
This is a nicely symmetric bell curve but a similar wealth distribution graph will show a miles long tail
Naturally occurring normal numeric distributions will tend towards a bell shape, or curve, as you acquire observations. Artificial distributions like income will follow a different curve that is sometimes difficult to visualize especially when the differences are measured in millions or billions. It’s easier to visualize the differences in artificial distributions if you use a natural distribution as a familiar basis.
Tl;Dr Do you think Paul Bunyan and Paul Blart are related?
Only if they both know who took Karl