

The best part of this is the subtle implication that you can tell a million completely different stories with the same data.
Having spent an unfortunate amount of time debunking bullshit statistics… yes.
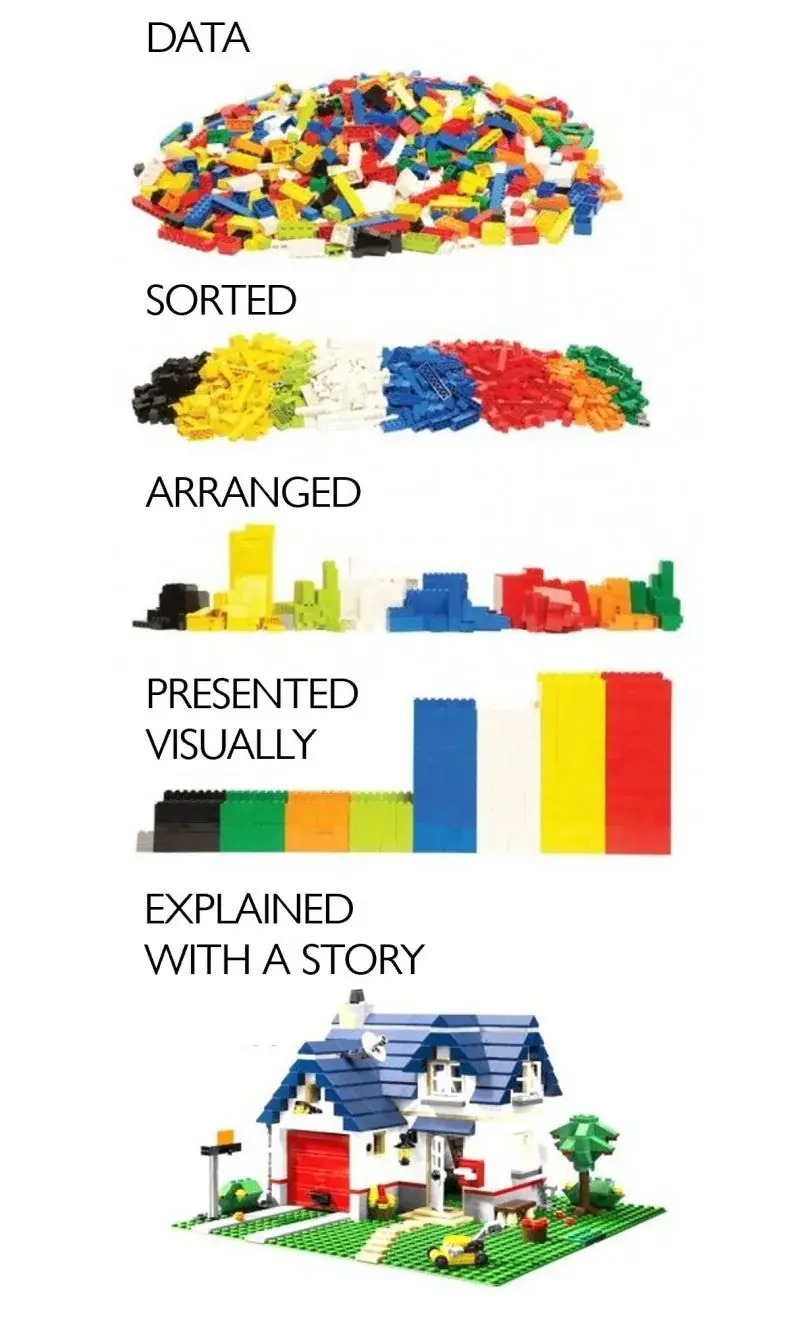
You just need to pick the pieces you want and discard/ignore the ones you don’t!
And invent the special pieces you need to tell the story you want.
Where the fuck was that baseplate hiding?
The baseplate came from the green in the bar graph. As we know all, the base plate is the foundation for any major project. Regardless that the bar graph shows little green compared to everything else. Green is far more important and we should focus all our efforts on the color green.
In a major coincidence, green is the color of money and I am now moving into a bigger house.
Edit: The fact that I got upvotes for a poorly written post amazes me.
It’s missing the original, before being reduced to data, being completely different from the “story”.
Not to mention that the story quite obviously does not fit the data at all.
Well that’s just statistics.
The relationship between statistics and the base facts is the difference between it being a useful tool or the butt of a Mark Twain’s joke.
Yeah, like where the hell is all the red? Either there’s a secret chamber under the house, or there is a little bloodbath murder suicide happening in that house
Where is all that yellow?
In the lawnmower, the lights on the house, the flowers on the bushes, and in the giant lake of piss behind the house.
There’s very little similarity between the pictures. White is the 3rd biggest stack, but you can see it’s not dominant on the data.
To;dr it’s all lies
This was a poor analysis of the data.
this is so freaking good, I cannot tell you how often I am told I have all the data and I should be able to make xyz work
and I am just a recently hired systems administrator that has to deal with my bosses paper notes and the person I replaced lack of documentation
I hate when computer scientists use “sorting” for “ordering”. It’s been mistranslated into other languages, too.
I am very new to the world of CS but I appreciate precise vocabulary. Is my understanding below correct?
-
Sorting = Assigning each object to one category (“bin”).
-
Ordering = Like sorting, but the categories themselves have an inherent hierarchy/order (numerical, alphabetical, etc.)
Yes but people say “sorting algorithms” when describibg programs that put elements of a list in the correct order.
-
sort, verb: “to put a number of things in an order or to separate them into groups”
Radix sort is truly a sorting algorithm though, it just results in an ordering.
Presented visually > Story
Where are all the yellow blocks in the final product? Why is nobody asking this?
The yellow blocks didn’t fit the desired story, so were disregarded as outliers.
Where did the grass plates come from?
There’s an inside…
And then when the house is disassembled into pieces again, its houseness lives on forever in heaven.


